
This article has been contributed by Eddie Segal.
Without a proper way to measure your marketing processes, you can’t tell if you’re making any progress or going in the entirely wrong direction. That’s why analyzing Instagram activity is crucial to the success of any business that uses Instagram for marketing.
Fortunately, Instagram provides a native analytics tool, Instagram Insights. Business owners and social media managers can use this tool to keep an eye on their accounts’ metrics. By analyzing the data that Insights provides, companies can make more effective marketing funnels and optimize customer journeys.
What Are Instagram Insights?
Instagram Insights is an analytics tool that provides data on content interactions, follower actions, and follower demographics. Accessed from within the Instagram platform, you can use Insights to assess trends across your followers and analyze your content performance. Content creators and business owners can then use those metrics to grow their business.
How to Access Instagram Insights
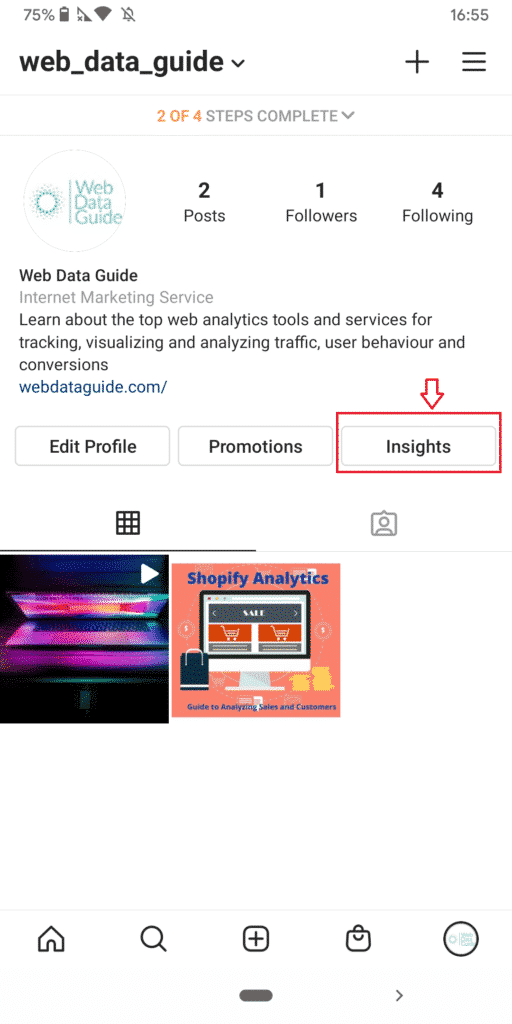
Access your insights by viewing your Instagram profile on the app. You will see a button under your bio that reads “Insights.”
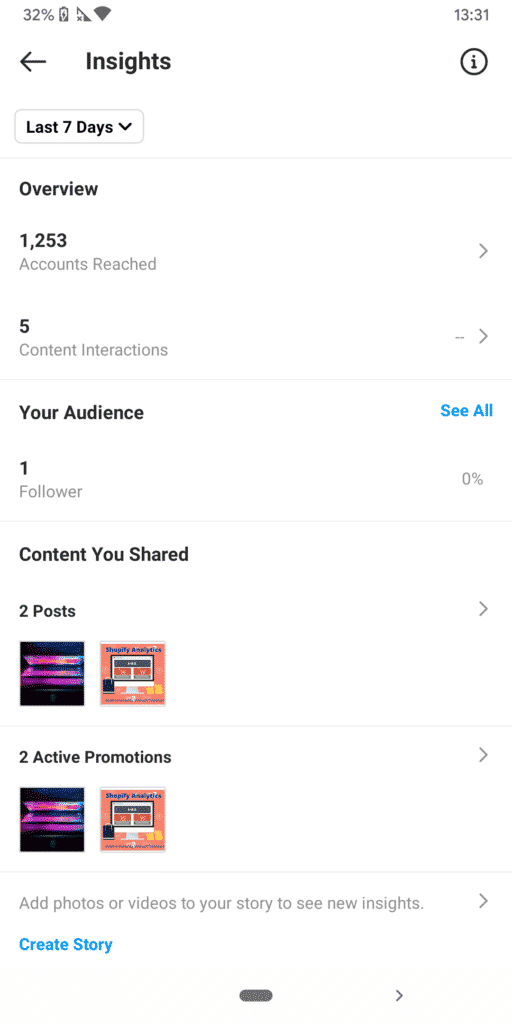
Once you have clicked into insights, you are greeted by the overview page, which gives statistics on the last seven days or last 30 days.
Here you will see:
- Accounts reached — the percentage of new accounts reached compared to the previous week.
- Content interactions — the percentage of interactions with your content compared to the previous week.
- Total followers — follower growth compared to the last week.
- Content you shared — a list of all your posts.
- Stories — a list of all your stories.
What Metrics Are Available on Instagram Insights?
Let’s take a deep dive and break down what metrics you can get from each category by clicking on the arrow to the right of each statistic.
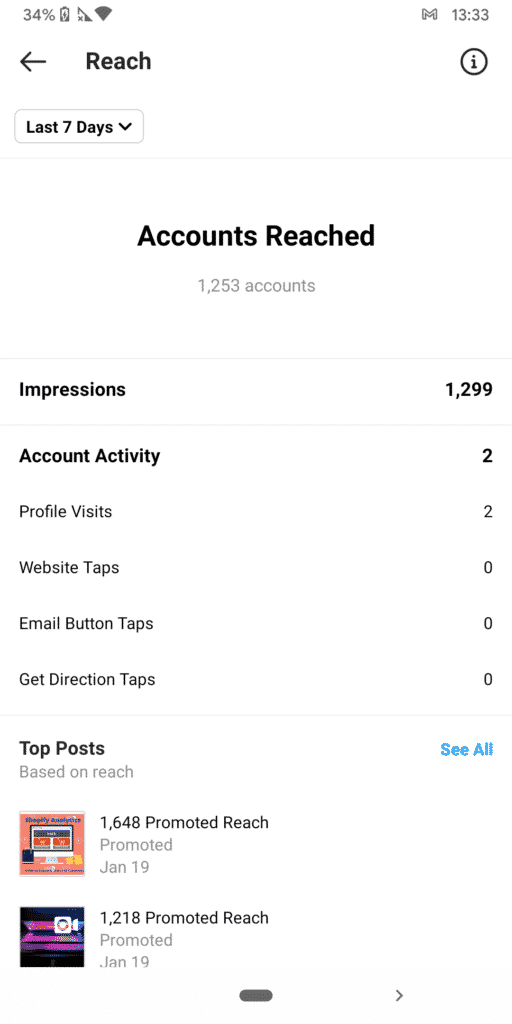
Accounts Reached
- Bar chart — shows how many people you reached each day. You should see a correlation between which days you post and reach.
- Impressions — the total amount of times people have seen your content.
- Account activity —
- Profile visits — how many people saw a piece of your content and clicked through to view your profile.
- Website taps — how many times your website link in bio was tapped.
- Email button taps — how many times the email button on your profile was tapped.
- Top posts — which posts reached the most accounts
- Top stories — which stories reached the most accounts
- Top IGTV videos — which IGTV videos reached the most accounts
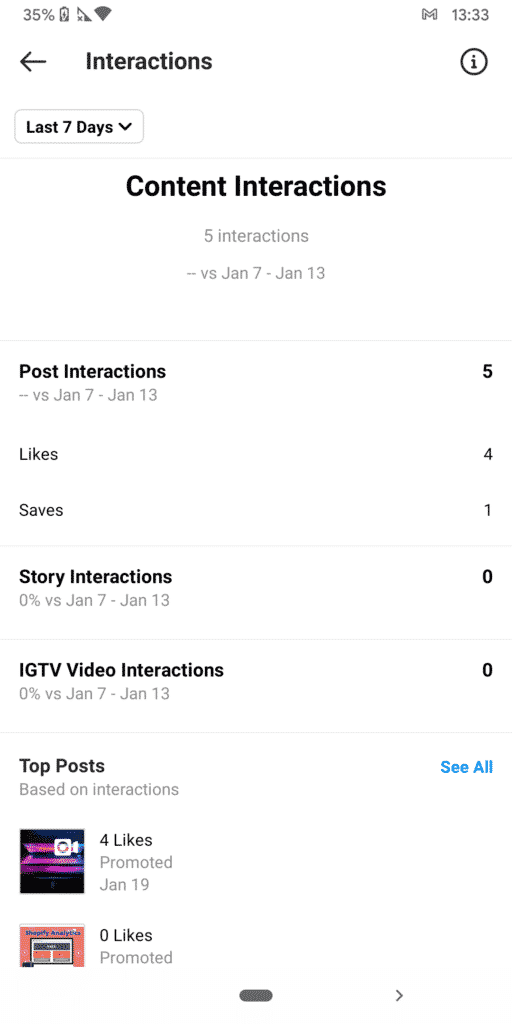
Content Interactions
- Total interactions — percentage difference compared to last week
- Post interactions — the number of likes, comments, saves, shares
- Story interactions — the amount of replies, shares
- IGTV interactions — the amount of likes, comments, saves
- Top posts, stories, and IGTV videos — in terms of the amount of interactions
Total Followers
- Follower breakdown — number of followers and percentage of increase or decrease compared to last week
- Growth — overall growth, total new follows, and total unfollows
- Top location — shows where your followers are from
- Age range — gives a breakdown of how many followers you have in each age range
- Gender — provides a pie chart breaking down male to female ratio
- Most active times — gives active times by hour and by day of the week. You can click on the bar chart for figures.
How to Use Insights to Grow Your Business
You now have a base level understanding of what Instagram Insights can offer and what they mean. What can you do to leverage the information to grow your business? We will explore how to use each category to your advantage.
1. Increase Your Accounts Reached
While impressions are simply the number of times a piece of content has been displayed, account reached tells you how many unique accounts have seen the content. If one user scrolls by the same piece of content twice, that equals two impressions but only one instance of reach.
So why does reach matter to your business? If you are trying to build brand awareness, it should be your goal to increase your reach. You can get more possible customers when more people get exposed to your product and brand name.
If your reach is off the charts, but your interactions are low – you have a problem. For brands looking for growth in terms of sales, you’ll want to ensure that you have a healthy relationship between reach, profile visits, and website clicks. If you don’t see a positive correlation, it’s time to rethink your content strategy.
2. Analyze Content Interactions
Content interactions are the most useful Instagram Insight category for growing your business.
The main goal of sharing content is to get likes, comments, shares, and saves. By analyzing which posts get the most interactions, you can adjust your content strategy to cater to what your followers respond to the most. You will see higher reach as you align your strategy with top performing content, and your current followers share more.
How to Analyze Content Interactions
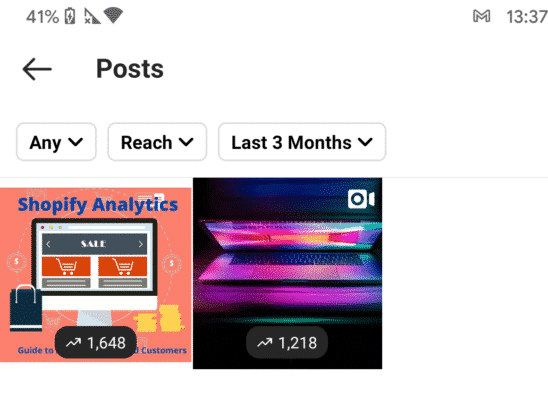
To view content interactions on your main feed posts, go to Insights, content interactions, and then top posts. This grid will show a number at the bottom of each post. By clicking the “reach” button at the top, you can then filter by metric.
We recommend filtering by comments, saves, shares, reach, website clicks, and follows. Instagram allows you to filter one post at a time. When you go back to the main grid, you’ll see the number at the bottom of each post change based on what metric you have filtered.
Next, we suggest filtering by three months. The last seven days and last 30 day filters are useful for a snapshot of current engagement. However, the three-month mark allows you to see data after each post has had enough time to build interactions.
This will give you the clearest idea of engagement before making any decisions around changing your content plan. As you filter by each of the metrics above, ask yourself the following:
- What topics are doing well? Which ones aren’t?
- What formats are popular? What formats aren’t?
- What themes are getting the most interaction? What themes are unpopular?
Main takeaway with content interaction metrics
Study what type of posts (post, story, IGTV, etc) get the most interactions. With your top posts, think about what made the photo impactful and what made the caption special. How can you include the positive aspects of these posts in additional content?
Conversely, what posts did the worst, and what do they have in common? Adjust your content strategy to match what your followers are interacting with to see sizable growth.
3. Use the Carousel Feature for Informative Posts
If you are a business that shares a lot of informative posts, you should use the carousel feature in your posts. According to Social Insider, carousel posts get 1.65% to 5.13% more engagement than singular photos or videos. Make sure that your carousel posts yield results in line with this statistic. If not, you need to ask yourself if what you’re sharing is truly valuable to your followers.
Perhaps you see that your informative posts get lots of likes, shares and saves, yet the carousel photos you share of products get much fewer. Change your filter out to comments and likes – see a difference?
People are more likely to save and share posts that contain information they want to come back to later. They are more likely to like and comment on photos of people and things they appreciate now but do not need to go back. These likes and comments are just as crucial as shares and saves. To grow your business, you‘ll need to strike a balance.
4. Increase Website Clicks for Greater Conversions
The website clicks metric is hugely important for businesses. Are your product photos leading to website clicks? If not, you’ll need to consider upping your photo quality, updating the caption, or reconsidering the hashtags.
As Social Insider states, the perfect caption has ten words or less and 20 emojis. Posts following this format have more engagement than longer captioned posts. People want short, concise verbiage with emojis to add that human touch. Do your posts reflect these statistics? If not, consider trying this strategy out for yourself.
5. Use Stories for Growth
Unlike the other content types, Instagram Stories disappear after 14 days – so it is important to review these insights more often. We recommend analyzing your stories’ reach and replies.
- Reach will help you assess retention — this is how many people are watching your stories from the first slide to the last. A simple calculation to determine this is to take the reach number of your last story multiplied by 100. Then take this new number divided by the reach number of your first story. This will tell you the percentage of people watching from beginning to end.
- Replies — which stories are engaging your followers to start a conversation?
6. Grow Your Followers
After you’ve analyzed your reach and content insights, you should consider how your follower metrics relate to what you’ve learned. If you’ve had a particularly good month with reach and content interactions – does your follower growth reflect that? You should use each aspect of Instagram Insights to paint one picture.
As you analyze your follower statistics, ask yourself the following questions:
- Do the statistics align with your target market?
- Can you better cater to your audience – age range, location, whether they are male or female, etc.? You might be able to adjust your tone, language, or imagery to better resonate with your followers.
- Are you posting when they are most active? If not, try posting at the height of their activity and track the changes in your metrics.
Instagram Insights and Content Strategy
Instagram Insights are a very useful set of metrics, but only when applied correctly. You must have a strong base to begin with. If you do not have a strong content strategy, your metrics will reflect that. You won’t be able to track meaningful growth through Insights without it.
For an effective content strategy, you must define your niche. How are you providing value to your followers with every post?
Next, ensure you are creating share-worthy content. Is the content you provide something that people will scroll through mindlessly?
Create captivating content so that they pause to read the caption and tag a friend. If you do not see this reflected in your content interaction, it’s time to rethink your strategy.
Remember, quality over quantity. Users are more likely to engage with content that is thoughtfully created and meaningful – they want to see that you have an honest voice. You must know your industry, and understand your audience intent in order to do this.
Finally, you’ll need a consistent color scheme. When people who tap into your profile after seeing a post they like – you want them to stick around. Make sure that your grid is cohesive, inviting, and tells a story.
It’s important to note that Insights are not perfect. You may sometimes notice discrepancies between Instagram Insights and social media analytics tools. This is partially because of the fact that Instagram’s Insights only track organic data. That is to say, they do not account for activity on content that includes ads.
Final Thoughts
First and foremost, create a schedule to review your Insights. We recommend reviewing your Insights at least once a month. Take a moment at the end of the month to review the content you put out. What patterns do you see amongst content that did well? What patterns exist amongst content that did poorly?
Apply your takeaways to your content strategy. With a well-rounded strategy, you should be having success within each metric and insight. Comments, likes, shares, saves, taps – they all matter.
Within your strategy, you should have a plan for posting frequency. In an ideal world, it would look something like this:
- Stories: post daily
- Main feed posts: 3-5 times per week
- Reels: 2-5 times per week
- IGTV, Live: once a week
The good news is that you have the tools, Insights are here to help you grow your business. A strong content strategy is key. Take what you learn from your Instagram Insights and adjust your strategy as needed. There you have it – a perfect recipe to grow your business on Instagram.
_
About the author: Eddie Segal is an experienced web analytics specialist and technology writer. In his writing, He covers subjects ranging from cloud computing to agile development to cybersecurity and deep learning. He also specializes in SEO, link building, and content strategies for technology brands. To find out more go to his website webdataguide.com